# init repo notebook
!git clone https://github.com/rramosp/ppdl.git > /dev/null 2> /dev/null
!mv -n ppdl/content/init.py ppdl/content/local . 2> /dev/null
!pip install -r ppdl/content/requirements.txt > /dev/null
Lab 02.02.1: Marginals, Conditionals, and Joints#
## Ignore this cell
!pip install ppdl==0.1.5 rlxmoocapi==0.1.0 --quiet
import inspect
from rlxmoocapi import submit, session
from ppdl.samplers import FluSeasonContactSampler

course_id = "ppdl.v1"
endpoint = "https://m5knaekxo6.execute-api.us-west-2.amazonaws.com/dev-v0001/rlxmooc"
lab = "L02.02.01"
Log-in with your username and password:
session.LoginSequence(
    endpoint=endpoint,
    course_id=course_id,
    lab_id=lab,
    varname="student"
    );
Base libraries:
import pandas as pd
import numpy as np
Task 1: Marginal Probabilities#
Consider the following probabilistic graphical model that represents the relationship between three random variables:
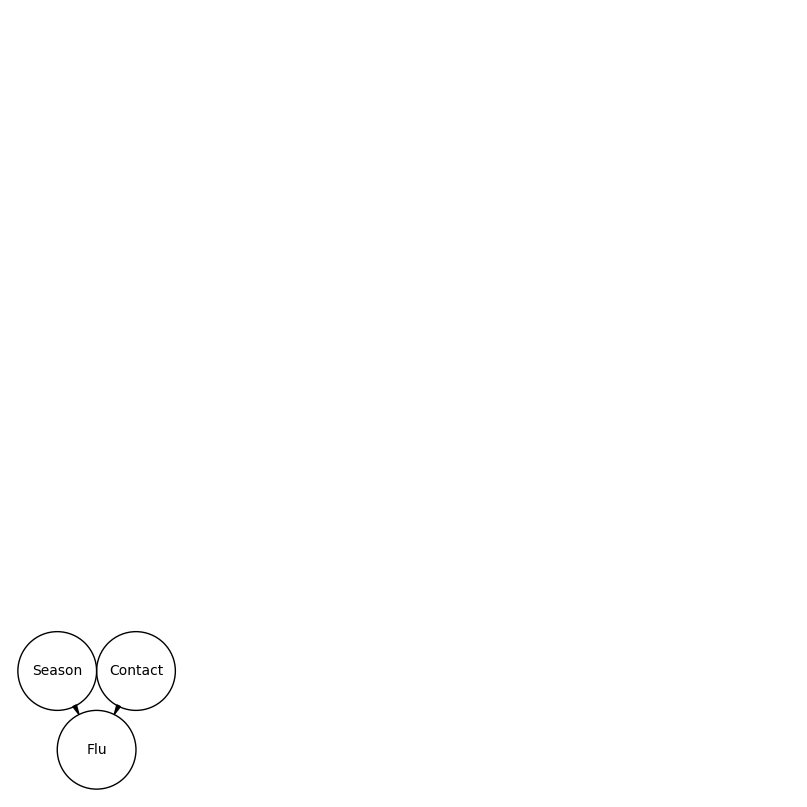
\(\mathcal{X}_1 \in \{"Winter", "Spring", "Summer", "Autumn"\}\): the current season.
\(\mathcal{X}_2 \in \{0, 1\}\): if a person had contact with another person with flu in the last week.
\(\mathcal{Y} \in \{0, 1\}\): if a person has flu.
Consider the following historical data:
sampler = FluSeasonContactSampler()
df = sampler(n_samples=1000, seed=42)
df
CHALLENGE: Implement a function that returns the marginal probability for a specific value in any of the three variables in the dataset:
def marginal(data, variable, value):
    """
    Implement this function to calculate the marginal probability of y.

    Parameters
    ----------
    data: DataFrame
        The dataframe containing the data.
    variable: str
        The variable to calculate the marginal probability of.
    value: str | int
        The value of the variable to calculate the marginal probability of.

    Returns
    -------
    prob : float
        The marginal probability of the variable in the given value.
    """
    ...
Test your code, the following cases should be:
> marginal(df, "y", 1)
0.34

> marginal(df, "x_1", "winter")
0.271

> marginal(df, "x_2", 0)
0.482
marginal(df, "y", 1)
marginal(df, "x_1", "winter")
marginal(df, "x_2", 0)
student.submit_task(namespace=globals(), task_id="T1");
Task 2: Conditional Probabilities#
Considering the same graphical model, consider the following historical data:
df = sampler(n_samples=1000, seed=0)
df
CHALLENGE: Implement the conditional function, so that it returns the conditional probability \(P(\mathcal{Y}|\mathcal{X}_1, \mathcal{X}_2)\).
def conditional(data, x_1_value, x_2_value, y_value):
    """
    Implement this function to calculate the conditional probability of y.

    Parameters
    ----------
    data: DataFrame
        The dataframe containing the data.
    x_1_value: str
        Season
    x_2_value: int
        Contact
    y_value: int
        Flu

    Returns
    -------
    prob : float
        The conditional probability of the variable in the given value.
    """
    ...
Test your code, the following cases should be:
> conditional(df, "spring", 0, 1)
0.1417

> conditional(df, "winter", 1, 1)
0.6590

> conditional(df, "autumn", 1, 0)
0.4919
# probability of flu given season is spring and contact is 0
conditional(df, "spring", 0, 1)
# probability of flu given season is winter and contact is 1
conditional(df, "winter", 1, 1)
# probability of no flu given season is autumn and contact is 1
conditional(df, "autumn", 1, 0)
student.submit_task(namespace=globals(), task_id="T2");
Task 3: Joint Probabilities#
Consider the same graphical model, use the following historical data:
df = sampler(n_samples=1000, seed=20)
df
CHALLENGE: Implement the joint function, so that it returns the joint probability \(P(\mathcal{Y}, \mathcal{X}_1, \mathcal{X}_2)\) for any input variable, you must use the functions from the task 1 and 2 by deducing an expression from the graphical model.
def joint(data, x_1_value, x_2_value, y_value):
    """
    Implement this function to calculate the joint probability.

    Parameters
    ----------
    data: DataFrame
        The dataframe containing the data.
    y_value: int
        If the person has flu.
    x_1_value: str | int
        The value of the first variable to calculate the joint probability of.
    x_2_value: str | int
        The value of the second variable to calculate the joint probability of.

    Returns
    -------
    prob : float
        The joint probability of the variable in the given value.
    """
    ...
Test your code, the following cases should be:
> joint(df, "spring", 1, 0)
0.0923

> joint(df, "winter", 1, 1)
0.0745

> joint(df, "autumn", 1, 0)
0.0681
# probability of no flu and spring and contact
joint(df, "spring", 1, 0)
# probability of flu and winter and contact
joint(df, "winter", 1, 1)
# probability of no flu and autumn and contact
joint(df, "autumn", 1, 0)
student.submit_task(namespace=globals(), task_id="T3");