
LAB 04.01 - Cleaning Data
!wget --no-cache -O init.py -q https://raw.githubusercontent.com/rramosp/20201.xai4eng/master/content/init.py
import init; init.init(force_download=False); init.get_weblink()

init.endpoint
from local.lib.rlxmoocapi import submit, session
student = session.Session(init.endpoint).login( course_id=init.course_id,
                                                session_id="UDEA",
                                                lab_id="L04.01" )
init.get_weblink()
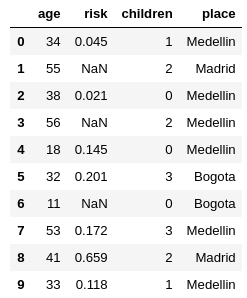
observe the following synthetic example with missing data
import pandas as pd
import matplotlib.pyplot as plt
%matplotlib inline
from IPython.display import Image
import numpy as np
import seaborn as sns
n = 20
place = np.r_[["Medellin", "Bogota", "Madrid"]][(np.random.randint(3, size=n))]
age = np.random.randint(50, size=n)+10
children = np.r_[[(np.random.randint(2) if i<30 else (np.random.randint(4))) for i in age]]
risk = np.r_[[np.random.random()*(.2 if i=="Medellin" else .8) for i in place]].round(3)
risk[np.random.permutation(len(risk))[:5]]=np.nan
d01 = pd.DataFrame([age, risk, children, place], index=["age", "risk", "children", "place"]).T
d01.to_csv("risk.csv", index=False)
d01
| age | risk | children | place | |
|---|---|---|---|---|
| 0 | 59 | 0.112 | 2 | Bogota |
| 1 | 36 | 0.093 | 1 | Medellin |
| 2 | 25 | 0.638 | 1 | Madrid |
| 3 | 57 | NaN | 1 | Madrid |
| 4 | 59 | 0.641 | 0 | Madrid |
| 5 | 50 | 0.111 | 3 | Bogota |
| 6 | 58 | 0.633 | 2 | Bogota |
| 7 | 13 | 0.025 | 0 | Medellin |
| 8 | 10 | NaN | 1 | Bogota |
| 9 | 58 | 0.299 | 3 | Madrid |
| 10 | 52 | 0.004 | 1 | Medellin |
| 11 | 47 | 0.2 | 0 | Madrid |
| 12 | 55 | NaN | 3 | Bogota |
| 13 | 44 | 0.742 | 3 | Madrid |
| 14 | 27 | NaN | 0 | Madrid |
| 15 | 54 | 0.567 | 2 | Bogota |
| 16 | 28 | 0.028 | 0 | Medellin |
| 17 | 24 | 0.299 | 1 | Bogota |
| 18 | 57 | NaN | 0 | Medellin |
| 19 | 40 | 0.081 | 2 | Medellin |
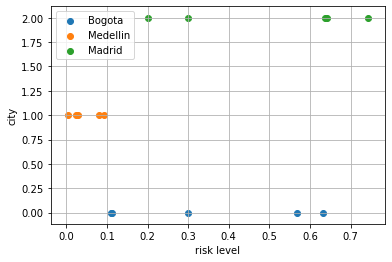
observe, in particular, that risk in Medellín is usually lower than in Bogotá, so we will try to fix missing data using this fact.
k = d01[d01.place=="Bogota"]["risk"].dropna()
plt.scatter(k, [0]*len(k), label="Bogota")
k = d01[d01.place=="Medellin"]["risk"].dropna()
plt.scatter(k, [1]*len(k), label="Medellin")
k = d01[d01.place=="Madrid"]["risk"].dropna()
plt.scatter(k, [2]*len(k), label="Madrid")
plt.grid();
plt.xlabel("risk level")
plt.ylabel("city")
plt.legend()
<matplotlib.legend.Legend at 0x7f25b2ddf7d0>
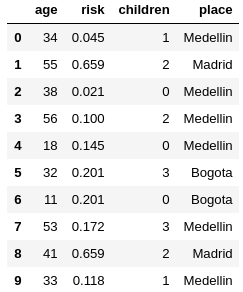
Task 1. FillNA in risk with corresponding city average
Observe that the above dataframe has been stored in the file risk.csv. You will have to fill in the missing values in the risk column with the related city mean in the following way:
Download the file
risk.csvCompute the mean risk per city
Substitute any missing value in the risk column by the corresponding city mean
Create a new csv file named
risk_fixed.csv, with the exact same structure but with the missing values replacedUpload your
risk_fixed.csvfile to the notebook environmentRun the evaluation cell below
Use the tool of your choice
(Excel, Orange, your programming language, or even this notebook if you can program python)
For Python, you do not have to download and upload anything, just use Pandas and store the resulting dataset in the variable r01
use three decimal places for precision
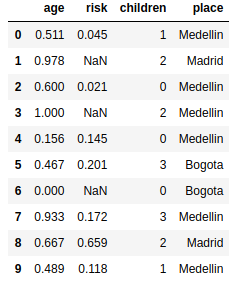
Task 2. Standardize age so that min=0, max=1
Standardizing values is, in certain cases, a necesity for ML models, providing stability and increased performance.
In this task you will have to standardize the column age so that all values stay in the [0,1] interval. Given any value \(x_i\), its corresponsing stardardized value \(s_i\) will be:
where \(min\), \(max\) is the minimum and maximum ages respectively
You must use again the file risk.csv and create and upload a file named age_minmax.csv with your answer. You should only modify the age column, leaving the rest as you find them in the csv file.
For Python, you do not have to download and upload anything, just use Pandas and store the resulting dataset in the variable r02
For the previous example, the correct answer would be
Image("local/imgs/cities-ageminmax.png")
load your file
r02 = pd.read_csv("age_minmax.csv")
r02
submit your answer
student.submit_task(globals(), task_id="task_02");
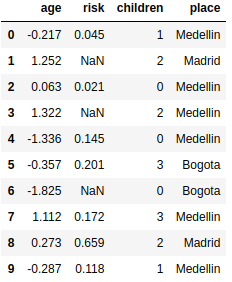
Task 3. Standardize age so that \(\mu=0\) and \(\sigma=1\)
In this task you will have to standardize the column age so that all values stay have zero mean and standard deviation of 1. Given any value \(x_i\), its corresponsing stardardized value \(s_i\) will be:
where \(\mu\) is the mean of all age values, and \(\sigma\) is the standard deviation.
You must use again the file risk.csv and create and upload a file named age_meanstd.csv with your answer. You should only modify the age column, leaving the rest as you find them in the csv file.
For Python, you do not have to download and upload anything, just use Pandas and store the resulting dataset in the variable r03
For the previous example, the correct answer would be
Image("local/imgs/cities-agemeanstd.png")
load your file
r03 = pd.read_csv("age_meanstd.csv")
r03
submit your answer
student.submit_task(globals(), task_id="task_03");
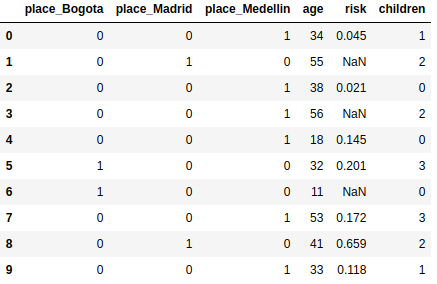
Task 4. Create a one-hot encoding for place
substitute the column place for three new columns with onehot encoding. You must use again the file risk.csv and create and upload a file named place_onehot.csv with your answer.
For Python, you do not have to download and upload anything, just use Pandas and store the resulting dataset in the variable r04
The solution for the example above should look like this. Observe that you must name the columns as shown here:
Image("local/imgs/cities_onehot.png")
load your file
r04 = pd.read_csv("place_onehot.csv")
r04
submit your answer
student.submit_task(globals(), task_id="task_04");