
LAB 4.3 - Object detection#
!wget -nc --no-cache -O init.py -q https://raw.githubusercontent.com/rramosp/2021.deeplearning/main/content/init.py
import init; init.init(force_download=False);
from local.lib.rlxmoocapi import submit, session
session.LoginSequence(endpoint=init.endpoint, course_id=init.course_id, lab_id="L04.03", varname="student");
import pandas as pd
import matplotlib.pyplot as plt
from skimage import io
import numpy as np
%matplotlib inline
from IPython.display import Image
TASK 1: Create anchor boxes#
observe how we download and extract the first 20K bounding-box annotations from the Open Images V6 dataset, out of the total 14M available. We are interested in the width and height of each box, which we must obtain by substracting the box coordinates, according to the description here. Recall that the coordinates are \(\in [0,1]\) as they are relative to the image size
!wget -nc https://storage.googleapis.com/openimages/v6/oidv6-train-annotations-bbox.csv
!wc oidv6-train-annotations-bbox.csv
!head -5 oidv6-train-annotations-bbox.csv
The X numpy array now contains the width and height of bounding boxes
!head -20001 oidv6-train-annotations-bbox.csv > oidv6-train-annotations-bbox-20k.csv
d = pd.read_csv('oidv6-train-annotations-bbox-20k.csv')
w = (d.XMax-d.XMin).values
h = (d.YMax-d.YMin).values
X = np.r_[[w,h]].T
X[:6]
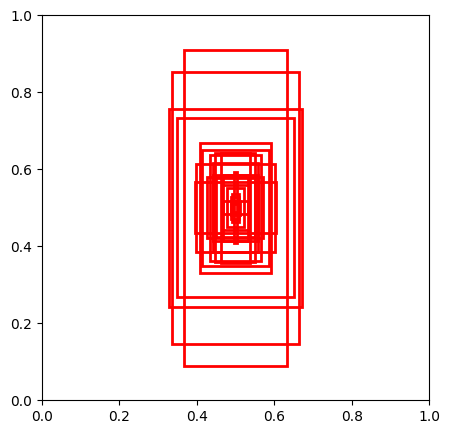
we can paint a sample of them
from matplotlib.patches import Rectangle
plt.figure(figsize=(5,5));
ax = plt.subplot(111)

for w,h in np.random.permutation(X)[:25]:
    ax.add_patch(Rectangle((0.5-w/2,0.5-h/2),w,h, linewidth=2,edgecolor='r',facecolor='none'))
Complete the following function such that it creates n anchor boxes from the bounding boxes in X using sklearn.cluster.KMeans with n_clusters set to the number of anchor boxes desired. After fitting KMeans, return cluster centers. Use the random_state passed as argument in KMeans.
def get_anchor_boxes(X, n, random_state=0):
    from sklearn.cluster import KMeans
    # YOUR CODE HERE
    km = ...
    return ...
you can visualize your anchor boxes. You should get something similar to this
Image("local/imgs/anchor_boxes.png", width=300)
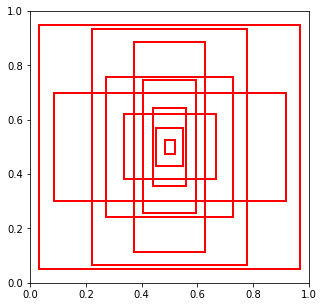
from matplotlib.patches import Rectangle
anchors = get_anchor_boxes(X, n=10, random_state=0)
plt.figure(figsize=(5,5));
ax = plt.subplot(111)

for w,h in anchors:
    ax.add_patch(Rectangle((0.5-w/2,0.5-h/2),w,h, linewidth=2,edgecolor='r',facecolor='none'))
Registra tu solución en linea
student.submit_task(namespace=globals(), task_id='T1');
----- grader message -------correct
----------------------------
TASK 2: Get closest anchor#
assume we have these anchor boxes, sorted by size
kc = np.array([0.03612632, 0.05025544, 0.0982887 , 0.1392435 , 0.11913009,
       0.28577818, 0.32945173, 0.23846835, 0.18874274, 0.48914381,
       0.25347843, 0.77500826, 0.45506799, 0.51589807, 0.83168319,
       0.39802428, 0.5539543 , 0.86824085, 0.93553054, 0.89561131]).reshape(10,2)
kc = kc[np.argsort(np.prod(kc, axis=1))]
anchors = pd.DataFrame(kc, columns=['w', 'h'])
anchors
Complete the following function so that, given a bounding box XMin, XMax, YMin, YMax and a dataframe with anchors such as kc above
returns the index of the most similar anchor to the bouding box.
Recall that all values \(\in [0,1]\)
Given two boxes (bounding box and anchor) with widths and heights \(w_0, h_0\) and \(w_1, h_1\), we define their similarity measure as:
Your return value must be an integer between 0 and 9
def get_closest_anchor_box(XMin, XMax, YMin, YMax, anchors):
  anchor_index = ...
  return anchor_index
you can visualize random annotations and their corresponding anchor boxes according to your function below. Your should see things like this one
Image("local/imgs/annotations-anchors.png", width=600)
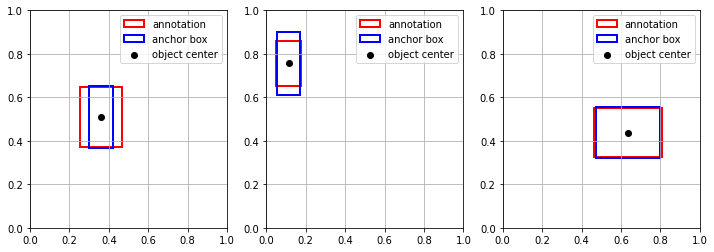
plt.figure(figsize=(12,4));
for i in range(3):
    b = d.iloc[np.random.randint(len(d))]
    bx, by = b.XMin + (b.XMax-b.XMin)/2, b.YMin + (b.YMax-b.YMin)/2
    bw, bh = b.XMax - b.XMin, b.YMax - b.YMin
    pw, ph = anchors.values[get_closest_anchor_box(b.XMin, b.XMax, b.YMin, b.YMax, anchors)]

    ax = plt.subplot(1,3,i+1)
    ax.add_patch(Rectangle((bx-bw/2,by-bh/2),bw,bh, linewidth=2,edgecolor='r',facecolor='none', label="annotation"))
    ax.add_patch(Rectangle((bx-pw/2,by-ph/2),pw,ph, linewidth=2,edgecolor='b',facecolor='none', label="anchor box"))
    plt.scatter(bx, by, color="black", label="object center")
    plt.grid(); plt.legend()
    plt.xlim(0,1); plt.ylim(0,1);
Registra tu solución en linea
student.submit_task(namespace=globals(), task_id='T2');
----- grader message -------correct
----------------------------
TASK 3: Compute desired model bounding box predictions#
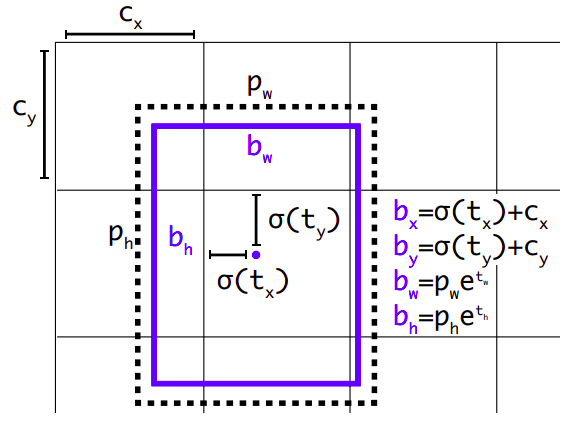
Understand the schema of YOLO coordinates below
\(b_w\), \(b_h\) are the width and height of the annotation we want the model to predict
\(b_x\), \(b_y\) are \(x\) and \(y\) coordinate of the annotation we want the model to predict
\(p_w\), \(p_h\) are the width and height of its closest anchor box
\(c_x\), \(c_y\) are the \(x\) and \(y\) coordinates of the TOP LEFT corner of the image cell responsible for detecting the annotation
Image("local/imgs/yolo_predictions.png", width=400)
Complete the following function such that, when given \(b_x\), \(b_y\), \(b_w\), \(b_h\), \(p_w\), \(p_h\), \(n_w\), \(n_h\) returns:
\(n_x \in \{0,1,..,n_x-1\}\), \(n_y \in \{0,1,..,n_y-1\}\): the cell number in which the annotation center (\(b_x\), \(b_y\)) falls in.
\(t_x\), \(t_y\), \(t_w\), \(t_h\): the desired model predictions according to the figure above
\(n_w\) and \(n_h\) specify the grid size in terms of number of cells wide and number of cells high.
def get_model_target_predictions(bx, by, bw, bh, pw, ph, nw, nh):
    # assume all x,y,w,h are in the [0,1] range, and nw, nh > 2

    nx = ...
    ny = ...
    tx = ...
    ty = ...
    tw = ...
    th = ...

    return nx, ny, tx, ty, tw, th
check your code. For the following values, you should get
\(n_x\), \(n_y\) =
1, 4\(t_x\), \(t_y\) =
-2.63, -3.89\(t_w\), \(t_h\) =
-0.92, 0.14
Make sure the values make sense (why are they positive or negative)
nw, nh = 7, 5
bx, by = 0.21, 0.82
bw, bh = 0.02, 0.15
pw, ph = 0.05, 0.13

get_model_target_predictions(bx, by, bw, bh, pw, ph, nw, nh)
try with other cases generated randomly
nw, nh = np.random.randint(6, size=2)+5
bx, by = np.round(np.random.random(size=2)*.4+.3,3)
bw, bh = np.round(np.random.random(size=2)*.25,3)
pw, ph = np.round(np.r_[bw, bh] * (1+np.random.random(size=2)*0.3-0.15),3)

print ("inputs", nw, nh, bx, by, bw, bh, pw, ph)
get_model_target_predictions(bx, by, bw, bh, pw, ph, nw, nh)
Registra tu solución en linea
student.submit_task(namespace=globals(), task_id='T3');
----- grader message -------correct
----------------------------