
LAB 03.01 - Model Generation#
!wget --no-cache -O init.py -q https://raw.githubusercontent.com/rramosp/ai4eng.v1/main/content/init.py
import init; init.init(force_download=False); init.get_weblink()
init.endpoint
from local.lib.rlxmoocapi import submit, session
session.LoginSequence(endpoint=init.endpoint, course_id=init.course_id, lab_id="L03.01", varname="student");
import numpy as np
import pandas as pd
import matplotlib.pyplot as plt
from sklearn.datasets import make_moons
from local.lib import mlutils
from IPython.display import Image
%matplotlib inline
A machine learning task#
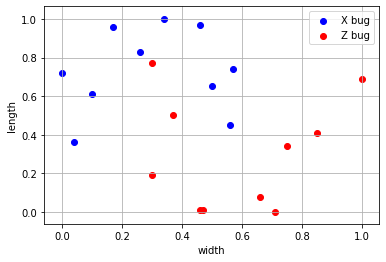
We have two species of bugs (X bugs and Z bugs), for each bug we have measured its width and length. Once we have a bug, determining if is of species X or species Z is very costly (lab analysis, etc.)
Machine learning goal: We want to create a model so that, when given the width and length of a bug, will tell us whether it belongs to species X or species Z. If the model performs well, we might use it insted of the lab analysis.
To train a machine learning model we built a training dataset where we have annotated 20 bugs with their confirmed species. The training dataset has:
20 data items
two data columns (width and length)
one label column, with two unique values: 0 for species X, and 1 for species Z.
d = pd.read_csv("local/data/trilotropicos_small.csv")
X,y = d.values[:,:2], d.values[:,-1]
print (d.shape, X.shape, y.shape)
print (X[:5])
print (y[:5])
d.head()
(20, 3) (20, 2) (20,)
[[0.5  0.65]
 [0.75 0.34]
 [0.37 0.5 ]
 [0.57 0.74]
 [1.   0.69]]
[0. 1. 1. 0. 1.]
| width | height | y | |
|---|---|---|---|
| 0 | 0.50 | 0.65 | 0.0 |
| 1 | 0.75 | 0.34 | 1.0 |
| 2 | 0.37 | 0.50 | 1.0 |
| 3 | 0.57 | 0.74 | 0.0 |
| 4 | 1.00 | 0.69 | 1.0 |
Since it is just two columns, we can visualize it
plt.scatter(X[y==0][:,0], X[y==0][:,1], color="blue", label="X bug")
plt.scatter(X[y==1][:,0], X[y==1][:,1], color="red", label="Z bug")
plt.xlabel("width");plt.ylabel("length"); plt.legend(); plt.grid();
Task 1. Manually use a predictive model#
We give you a procedure somewhat calibrated so that, given a new bug, it produces a prediction. The procedure depends on two parameters \(\theta_0\) and \(\theta_1\). Given the width \(w^{(i)}\) and height \(h^{(i)}\) of bug number \(i\), the prediction \(\hat{y}^{(i)} \in \{0, 1\}\) is computed as follows:
This can be considered as a model template, depending on two parameters.
Complete the following function so that whenever given a numpy array X \(\in \mathbb{R}^m \times \mathbb{R}^2\) containing the width and height of \(m\) bugs, returns a vector \(\in \mathbb{R}^m\) with the predictions of the \(m\) bugs as described in the expression above. The parameter t \(\in \mathbb{R}^2\) contains, in this order, \(\theta_0\) and \(\theta_1\)
Observe that your function must return a numpy vector of integers (not booleans).
CHALLENGE: solve it with one single line of code
HINT: use .astype(int) to convert a numpy array of booleans to integers.
def predict(X, t):
    return ...
check manually your code, your predictions with the following t must be
[1, 1, 0, 1, 1, 0, 0, 1, 1, 0, 0, 1, 0, 1, 0, 1, 1, 1, 0, 0]
with an accuracy of 0.75
t = np.r_[.5,.3]
y_hat = predict(X, t)
y_hat
np.mean(y==y_hat)
observe the classification boundary that the model generates
mlutils.plot_2Ddata_with_boundary(lambda X: predict(X,t), X, y); plt.grid();
and with other t … which is better?
t = np.r_[.5,.8]
mlutils.plot_2Ddata_with_boundary(lambda X: predict(X,t), X, y); plt.grid();
np.mean(y==predict(X,t))
observe the prediction boundaries of other models. Change the max_depth of the decision tree to 2. Does it look familiar?
from sklearn.linear_model import LogisticRegression
mlutils.plot_2Ddata_with_boundary(LogisticRegression().fit(X,y).predict, X, y); plt.grid();
from sklearn.tree import DecisionTreeClassifier
mlutils.plot_2Ddata_with_boundary(DecisionTreeClassifier(max_depth=5).fit(X,y).predict, X, y); plt.grid();
from sklearn.svm import SVC
mlutils.plot_2Ddata_with_boundary(SVC(gamma=50).fit(X,y).predict, X, y); plt.grid();
submit your answer
student.submit_task(globals(), task_id="task_01");
Task 2. Fit the model#
Given a set of annotated data \(X\), \(y\) and the model template of the previous exercise, complete the following function that returns \(\theta_0\) and \(\theta_1\) that produce the best accuracy on the given X and y. Consider only \(\theta_0\) and \(\theta_1\) with one decimal number between 0 and 1.
Hint: use a brute force approach, consider all combinations of \(\theta_0\) and \(\theta_1 \in\) [0.0, 0.1, 0.2, 0.3, 0.4, 0.5, 0.6, 0.7, 0.8, 0.9, 1.0]. Use np.linspace and itertools.product
Your function must return an numpy array with two elements, the resulting \(\theta_0\) and \(\theta_1\)
import itertools


def fit(X,y):
    def predict(X, t):
        return ...

    return ...
t = fit(X,y)
Check your solution with the code below. The t returned by your function should produce an accuracy of 0.9 with the example data X, y. There might be several t producing the same accuracy, you just have to return any of those.
mlutils.plot_2Ddata_with_boundary(lambda X: predict(X,t), X, y); plt.grid();
np.mean(y==predict(X,t))
you can also use your model on different data. Execute the next cells several times to see the effect on different datasets.
from sklearn.datasets import make_blobs
from sklearn.preprocessing import MinMaxScaler

bX, by = make_blobs(100,n_features=2, centers=2)
bX = MinMaxScaler(feature_range=(0.1,.9)).fit_transform(bX)
bt = fit(bX, by)
mlutils.plot_2Ddata_with_boundary(lambda X: predict(X,bt), bX, by); plt.grid();
np.mean(by==predict(bX,bt))
submit your answer
student.submit_task(globals(), task_id="task_02");
Task 3: Make an sklearn compatible class with your model#
organize the previous methods in the following class structure. Bear in mind that:
the
fitmethod now does not returnt, which is now stored in an instance variableself.tthe
fitmethod must now returnself.the
predictmethod now does not accepttas argument, it must use the one stored inself.t
def SimpleModel():
    class _SimpleModel:

        def __init__(self):
            pass

        def fit(self, X, y):

            ....
            return self

        def predict(self, X):
            return ....

    return _SimpleModel()
m = SimpleModel()
m.fit(X,y)
m.predict(X)
mlutils.plot_2Ddata_with_boundary(m.predict, X, y); plt.grid();
np.mean(y==m.predict(X))
check your model with different parametrizations of the moons dataset (more and less data points, more and less noise)
from sklearn.datasets import make_moons

mX, my = make_moons(100, noise=.1)
m = SimpleModel()
m.fit(mX,my)

mlutils.plot_2Ddata_with_boundary(m.predict, mX, my); plt.grid();
np.mean(my==m.predict(mX))
submit your answer
student.submit_task(globals(), task_id="task_03");