
LAB 03.02 - Timeseries model#
!wget --no-cache -O init.py -q https://raw.githubusercontent.com/rramosp/ai4eng.v1/main/content/init.py
import init; init.init(force_download=False); init.get_weblink()
from local.lib.rlxmoocapi import submit, session
session.LoginSequence(endpoint=init.endpoint, course_id=init.course_id, lab_id="L03.02", varname="student");
import numpy as np
import matplotlib.pyplot as plt
from local.lib import timeseries as ts
import pandas as pd
import os
from IPython.display import Image
from pandas.plotting import register_matplotlib_converters
register_matplotlib_converters()
%matplotlib inline
A synthetic timeseries#
date_split = "2018-03-01"
idx = pd.date_range("2018-01-01", "2018-03-31", freq="6h")
i = np.linspace(-5,4,len(idx))
i = np.linspace(np.random.random()*5-5,np.random.random()*5+2,len(idx))
t = np.log(i**2+.3)*np.cos(4*i)
t += (np.random.normal(size=len(idx))*.4)
t = np.round(t*3+30,3)
d = pd.DataFrame(np.r_[[t]].T, columns=["signal"], index=idx)
d.index.name="date"
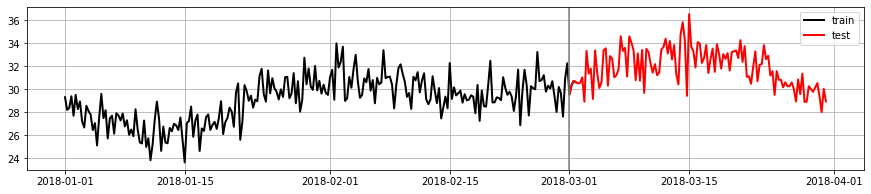
plt.figure(figsize=(15,3))
plt.plot(d[:date_split].index, d[:date_split].signal, color="black", lw="2", label="train");
plt.plot(d[date_split:].index, d[date_split:].signal, color="red", lw="2", label="test");
plt.axvline(date_split, color="grey"); plt.legend();plt.grid();
signal = d
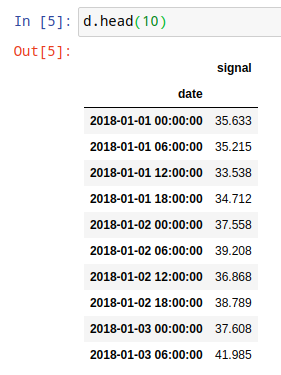
d.info()
d.head(10)
Task 1. Build a time series training dataset#
In this task, starting off from the time signal above, you must build an annotated dataset so that at any time instant given the three last n_timesteps_lookback signal values and the current one we want to predict the next one.
Complete the following function so that when receiving a time indexed dataframe such as the one above, the resulting dataframe is such that:
the column signal is left untouched
there are
n_timesteps_lookback+1 new columns:the column signal+1 contains the signal one time step into the future
the columns signal-1, signal-2, etc. contain the signal one, two, etc. time steps into the past.
the resulting dataset contains (
n_timesteps_lookback+1) rows less than the original dataset, one due to the signal+1 column and the rest for the signal-x columns. For instance, if the original dataset contained 357 rows, withn_timesteps_lookback=3the resulting dataframe will contain 353 rows.
Hint: use pandas.DataFrame.join, pandas.DataFrame.shift and pandas.DataFrame.dropna
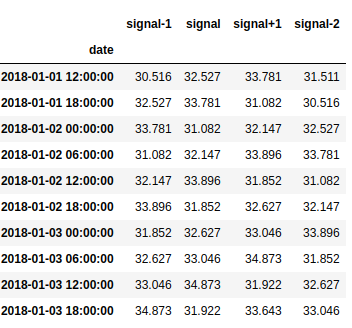
For instance, with this input
Image("local/imgs/df_tseries1.png")
you should produce the following output
Image("local/imgs/df_tseries2.png")
def make_timeseries_dataset(signal, n_timesteps_lookback):
    import pandas as pd
    r = ...
    return r
test your code
make_timeseries_dataset(d, n_timesteps_lookback=3).head(10)
submit your answer
student.submit_task(globals(), task_id="task_01");
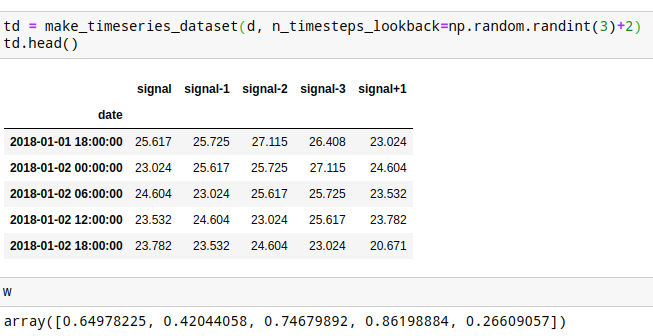
Task 2. Manually apply a regression model to create predictions#
Complete the following function to apply the a linear regression model to a dataframe such as the resulting one from the previous task:
where \(s\) corresponds to the column named signal, \(s_{-1}\) to the column named signal-1, etc.
Observe that:
column
signal+1is not used, as it is the expected prediction. You will use it in the next task.you will have
n_timesteps_lookback+2 \(w\) parameters, since you will have one per eachn_timesteps_lookback, plus \(w_0\), plus \(w_1\)
Expect the function arguments as follow:
td: a Pandas dataframe such as the output of the functionmake_timeseries_datasetof the previous task, with exactly the same column namesw: a Numpy array withn_timesteps_lookback+2 elements in the order \([w_0, w_1, ...]\)
Warn: the DataFrame td may contain any number of lookback columns and might be in any order
Challenge: solve it with one single line of Python code
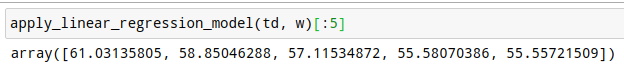
EXAMPLE: For the following dataframe and \(w\)
Image("local/imgs/ts_reg_1.png")
you should get the following results
Image("local/imgs/ts_reg_2.png")
def apply_linear_regression_model(td, w):
    r = ... # YOUR SOLUTION HERE
    return r
test your code manually#
observe how we permute the columns order
td = make_timeseries_dataset(d, n_timesteps_lookback=np.random.randint(3)+2)
td = td[np.random.permutation(td.columns)]
td.head()
w = np.random.random(len(td.columns))
w
apply_linear_regression_model(td[np.random.permutation(td.columns)], w)[:5]
submit your answer
student.submit_task(globals(), task_id="task_02");
Task 3: Measure trend prediction#
You will now use the predictions to measure trend accuracy. We will compare any predictions which are given to us with the actual next value in column signal+1 in the following way
if signal+1>signal and ALSO your prediction>signal, then your model has a correct trend prediction regardless how different are signal+1 and prediction
if signal+1<=signal and ALSO your prediction<=signal, then your model has a correct trend prediction regardless how different are signal+1 and prediction
otherwise, your model has an incorrect prediction
Complete the following function such that when receiving a dataframe such as the resulting one from task 1 above, and a pd.Series with the same index and price predictions, computes the accuracy of the predictions (the percentage of correct predictions).
The accuracy must be a float and its correctness will be checked up to 2 decimal places.
Challenge: solve it with one single line of Python code.
EXAMPLE: for the following time series dataset
Image("local/imgs/ts_reg_3.png")
And the following predictions
Image("local/imgs/ts_reg_4.png")
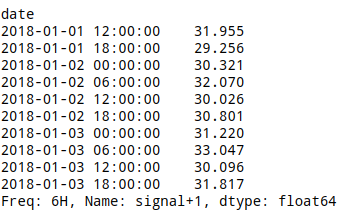
The trend accuracy is 0.4 since the trend is correctly hit by the predictions on rows 1, 4, 7 and 8 (assuming the first row is numbered as 0)
def measure_trend_accuracy(td, preds):
    r = ... # YOUR CODE HERE
    return r
test your code manually#
td = make_timeseries_dataset(d, n_timesteps_lookback=np.random.randint(3)+2).iloc[:10]
td
preds = td['signal'] + np.round(np.random.random()*4-2,3)
preds
measure_trend_accuracy(td, preds)
submit your answer
student.submit_task(globals(), task_id="task_03");