
LAB 06.01 - Clustering companies#
!wget --no-cache -O init.py -q https://raw.githubusercontent.com/rramosp/ai4eng.v1/main/content/init.py
import init; init.init(force_download=False); init.get_weblink()
from local.lib.rlxmoocapi import submit, session
session.LoginSequence(endpoint=init.endpoint, course_id=init.course_id, lab_id="L06.01", varname="student");
Dataset#
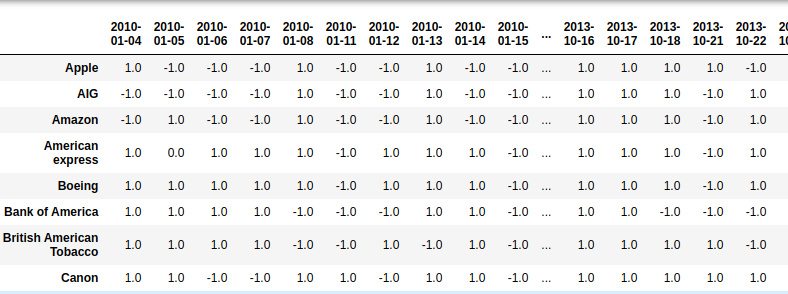
observe the following dataset with daily stock data from different companies
import pandas as pd
import numpy as np
import matplotlib.pyplot as plt
from IPython.display import Image
%matplotlib inline
d = pd.read_csv("local/data/company-stock-movements-2010-2015-incl.csv.gz", index_col=0)
d.shape
(60, 963)
d.head()
| 2010-01-04 | 2010-01-05 | 2010-01-06 | 2010-01-07 | 2010-01-08 | 2010-01-11 | 2010-01-12 | 2010-01-13 | 2010-01-14 | 2010-01-15 | ... | 2013-10-16 | 2013-10-17 | 2013-10-18 | 2013-10-21 | 2013-10-22 | 2013-10-23 | 2013-10-24 | 2013-10-25 | 2013-10-28 | 2013-10-29 | |
|---|---|---|---|---|---|---|---|---|---|---|---|---|---|---|---|---|---|---|---|---|---|
| Apple | 0.580000 | -0.220005 | -3.409998 | -1.170000 | 1.680011 | -2.689994 | -1.469994 | 2.779997 | -0.680003 | -4.999995 | ... | 0.320008 | 4.519997 | 2.899987 | 9.590019 | -6.540016 | 5.959976 | 6.910011 | -5.359962 | 0.840019 | -19.589981 |
| AIG | -0.640002 | -0.650000 | -0.210001 | -0.420000 | 0.710001 | -0.200001 | -1.130001 | 0.069999 | -0.119999 | -0.500000 | ... | 0.919998 | 0.709999 | 0.119999 | -0.480000 | 0.010002 | -0.279998 | -0.190003 | -0.040001 | -0.400002 | 0.660000 |
| Amazon | -2.350006 | 1.260009 | -2.350006 | -2.009995 | 2.960006 | -2.309997 | -1.640007 | 1.209999 | -1.790001 | -2.039994 | ... | 2.109985 | 3.699982 | 9.570008 | -3.450013 | 4.820008 | -4.079986 | 2.579986 | 4.790009 | -1.760009 | 3.740021 |
| American express | 0.109997 | 0.000000 | 0.260002 | 0.720002 | 0.190003 | -0.270001 | 0.750000 | 0.300004 | 0.639999 | -0.130001 | ... | 0.680001 | 2.290001 | 0.409996 | -0.069999 | 0.100006 | 0.069999 | 0.130005 | 1.849999 | 0.040001 | 0.540001 |
| Boeing | 0.459999 | 1.770000 | 1.549999 | 2.690003 | 0.059997 | -1.080002 | 0.360000 | 0.549999 | 0.530002 | -0.709999 | ... | 1.559997 | 2.480003 | 0.019997 | -1.220001 | 0.480003 | 3.020004 | -0.029999 | 1.940002 | 1.130005 | 0.309998 |
5 rows × 963 columns
d.index
Index(['Apple', 'AIG', 'Amazon', 'American express', 'Boeing',
       'Bank of America', 'British American Tobacco', 'Canon', 'Caterpillar',
       'Colgate-Palmolive', 'ConocoPhillips', 'Cisco', 'Chevron',
       'DuPont de Nemours', 'Dell', 'Ford', 'General Electrics',
       'Google/Alphabet', 'Goldman Sachs', 'GlaxoSmithKline', 'Home Depot',
       'Honda', 'HP', 'IBM', 'Intel', 'Johnson & Johnson', 'JPMorgan Chase',
       'Kimberly-Clark', 'Coca Cola', 'Lookheed Martin', 'MasterCard',
       'McDonalds', '3M', 'Microsoft', 'Mitsubishi', 'Navistar',
       'Northrop Grumman', 'Novartis', 'Pepsi', 'Pfizer', 'Procter Gamble',
       'Philip Morris', 'Royal Dutch Shell', 'SAP', 'Schlumberger', 'Sony',
       'Sanofi-Aventis', 'Symantec', 'Toyota', 'Total',
       'Taiwan Semiconductor Manufacturing', 'Texas instruments', 'Unilever',
       'Valero Energy', 'Walgreen', 'Wells Fargo', 'Wal-Mart', 'Exxon',
       'Xerox', 'Yahoo'],
      dtype='object')
TASK 1: convert d into a signed dataframe#
turn all values to 1 if >0 and -1 otherwise
the resulting dataset must look like the following image
HINT: use numpy.sign
Image("local/imgs/stock_signed.png")
def signed(d):
    result = ....
    return result
manually check your code
signed(d)
submit your code
student.submit_task(globals(), task_id="task_01");
Exercise 2: implement custom metric#
the intuition is that we want our metric to reward sets of symbols moving in sync.
So, given a matrix:
for each column compute the max number of positions with equal value.
divide by the number of elements in the column
average the value for all columns
for instance, for the following matrix
m  = np.array([[-1,  1,  1, -1],
               [-1, -1,  1, -1],
               [-1, -1,  1,  1],
               [-1, -1, -1,  1],
               [-1,  1,  1, -1],
               [-1, -1,  1, -1]])
the number of positions of equal value for each column is
6,4,5,4normalizing by the number of elements per column (6) is
1,0.6667,.8333,.6667the mean of the previous result is about
0.792
complete the following function to compute this metric, assuming the input matrix m is a numpy array containing only values of -1 and 1
suggested strategy: loop over the columns, compute the number of 1’s and -1’s and keep whichever is grater in each column, divide by the length of m (you will have then one number per column), and take the average.
challenge 1: solve it with one line
challenge 2: solve it without a loop, but using the axis argument when using np.sum and np.max
def mean_sync_move(m):
    result = ...
    return result
manually check your code
mean_sync_move(m)
the following must return 1
mean_sync_move(np.ones((10,2)))
obtain the mean_sync_move of the full dataset AFTER converting it into signed. It should be around 0.72
mean_sync_move(signed(d).values)
submit your code
student.submit_task(globals(), task_id="task_02");
Task 3: Cluster the full dataset#
complete the following function such that upon receiving a dataset:
obtains the signed dataset
uses
sklearnKMeansto cluster the dataset with the given number of clusters (n_clusters)predicts the cluster number of each company
for each cluster number:
filters the signed dataset so that it keeps the companies belonging to that cluster.
computes the
mean_sync_moveof the resulting filtered signed dataset.
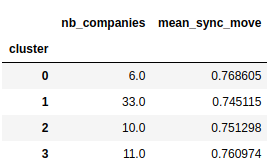
your function must return a dataframe with one row per cluster containing
the cluster number
the number of companies in the cluster
the
mean_sync_moveof each cluster
for instance, for 4 clusters your resulting dataframe should look like the following one. The cluster numbers might be in a different order, but the index and the columns MUST be as illustrated.
important: use random_state=2 when creating the KMeans instance.
Image(filename='local/imgs/labclusters.png')
from sklearn.cluster import KMeans

def cluster_dataset(d, n_clusters):

    def signed(d):
        return ... # your code here

    def mean_sync_move(m):
        return ... # your code here

    d = signed(d)

    c = KMeans(....)
    y = c.fit_predict(...)
    r = pd.DataFrame(...., columns=["cluster", "nb_companies", "mean_sync_move"])

    r.index = r.cluster.values.astype(int)
    r.index.name = "cluster"

    del(r["cluster"])
    return r
cluster_dataset(d, n_clusters=4)
submit your code
student.submit_task(globals(), task_id="task_03");
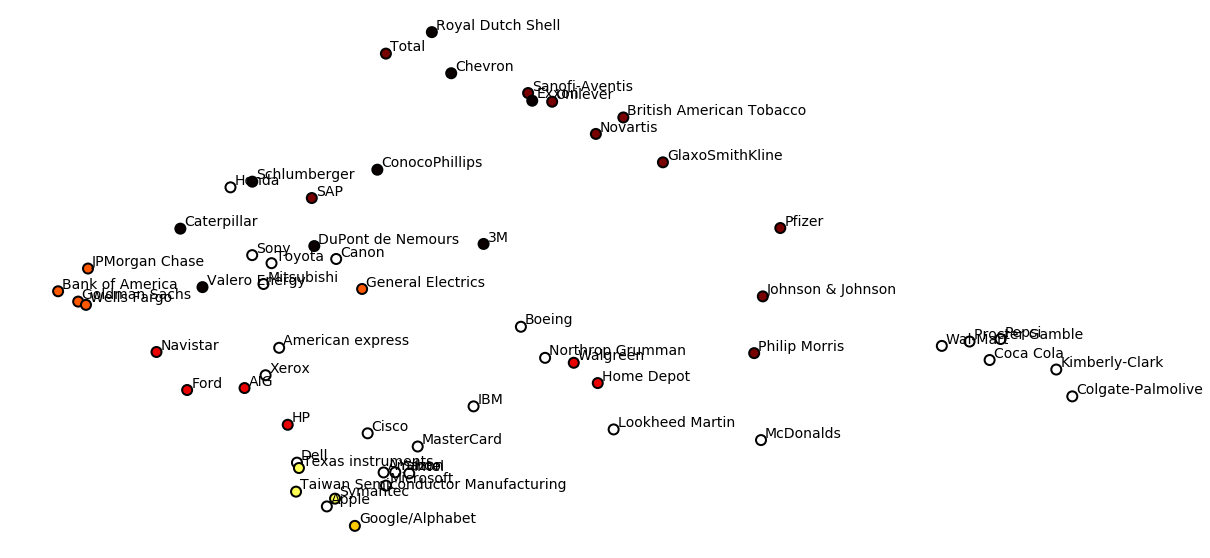
Compare with PCA#
we apply PCA with 2 components to +1/-1 dataset and visualize clusters
from sklearn.decomposition import PCA
n_clusters = 7

X = PCA(n_components=2).fit_transform(signed(d).values)
y = KMeans(n_clusters=10).fit_predict(signed(d).values)
cmap = plt.cm.hot
plt.figure(figsize=(20,10))
plt.scatter(X[:,0], X[:,1], color=cmap((y*255./(n_clusters-1)).astype(int)), s=100, edgecolor="black", lw=2)
for i in range(len(d)):
    name = d.index[i]
    plt.text(X[i,0]+.1, X[i,1]+.1,d.index[i], fontsize=14)
plt.axis("off");
Other suggested exercises#
Try the following exercises from O’Reilly’s Python Data Science Handbook, and its associated Notebook Repository at Chapter about Clustering :
Clustering, Exercise 1: k-Means on Digits
Clustering, Exercise 2: k-Means for Color Compression