01.01 - PROYECTO KAGGLE#
!wget --no-cache -O init.py -q https://raw.githubusercontent.com/rramosp/ai4eng.v1/main/content/init.py
import init; init.init(force_download=False); init.get_weblink()
download data directly from Kaggle#
create a file
kaggle.jsonwith your authentication token (in kaggle \(\to\) click user icon on top-right \(\to\) settings \(\to\) API create new token)upload it to this notebook workspace
run the following cell
import os
os.environ['KAGGLE_CONFIG_DIR'] = '.'
!chmod 600 ./kaggle.json
!kaggle competitions download -c udea-ai4eng-20242
Downloading udea-ai4eng-20242.zip to /content
 25% 5.00M/20.1M [00:00<00:00, 27.1MB/s]
100% 20.1M/20.1M [00:00<00:00, 78.1MB/s]
unzip and inspect data#
!unzip udea*.zip > /dev/null
!wc *.csv
   296787    296787   4716673 submission_example.csv
   296787   4565553  50135751 test.csv
   692501  10666231 118025055 train.csv
  1286075  15528571 172877479 total
load train.csv data with pandas#
import pandas as pd
import numpy as np

z = pd.read_csv("train.csv")
print ("shape of loaded dataframe", z.shape)
shape of loaded dataframe (692500, 12)
z.head()
| ID | PERIODO | ESTU_PRGM_ACADEMICO | ESTU_PRGM_DEPARTAMENTO | ESTU_VALORMATRICULAUNIVERSIDAD | ESTU_HORASSEMANATRABAJA | FAMI_ESTRATOVIVIENDA | FAMI_TIENEINTERNET | FAMI_EDUCACIONPADRE | FAMI_EDUCACIONMADRE | ESTU_PAGOMATRICULAPROPIO | RENDIMIENTO_GLOBAL | |
|---|---|---|---|---|---|---|---|---|---|---|---|---|
| 0 | 904256 | 20212 | ENFERMERIA | BOGOTÁ | Entre 5.5 millones y menos de 7 millones | Menos de 10 horas | Estrato 3 | Si | Técnica o tecnológica incompleta | Postgrado | No | medio-alto |
| 1 | 645256 | 20212 | DERECHO | ATLANTICO | Entre 2.5 millones y menos de 4 millones | 0 | Estrato 3 | No | Técnica o tecnológica completa | Técnica o tecnológica incompleta | No | bajo |
| 2 | 308367 | 20203 | MERCADEO Y PUBLICIDAD | BOGOTÁ | Entre 2.5 millones y menos de 4 millones | Más de 30 horas | Estrato 3 | Si | Secundaria (Bachillerato) completa | Secundaria (Bachillerato) completa | No | bajo |
| 3 | 470353 | 20195 | ADMINISTRACION DE EMPRESAS | SANTANDER | Entre 4 millones y menos de 5.5 millones | 0 | Estrato 4 | Si | No sabe | Secundaria (Bachillerato) completa | No | alto |
| 4 | 989032 | 20212 | PSICOLOGIA | ANTIOQUIA | Entre 2.5 millones y menos de 4 millones | Entre 21 y 30 horas | Estrato 3 | Si | Primaria completa | Primaria completa | No | medio-bajo |
we will do a model using only two columns#
we have to predict column
RENDIMIENTO_GLOBALusing the restwe will use columns
FAMI_EDUCACIONMADREwhich we will need to convert to a onehot encodingESTU_VALORMATRICULAUNIVERSIDADwhich we will need to convert to a continuous encoding
z = z[['FAMI_EDUCACIONMADRE', 'ESTU_VALORMATRICULAUNIVERSIDAD', 'RENDIMIENTO_GLOBAL']]
z.head()
| FAMI_EDUCACIONMADRE | ESTU_VALORMATRICULAUNIVERSIDAD | RENDIMIENTO_GLOBAL | |
|---|---|---|---|
| 0 | Postgrado | Entre 5.5 millones y menos de 7 millones | medio-alto |
| 1 | Técnica o tecnológica incompleta | Entre 2.5 millones y menos de 4 millones | bajo |
| 2 | Secundaria (Bachillerato) completa | Entre 2.5 millones y menos de 4 millones | bajo |
| 3 | Secundaria (Bachillerato) completa | Entre 4 millones y menos de 5.5 millones | alto |
| 4 | Primaria completa | Entre 2.5 millones y menos de 4 millones | medio-bajo |
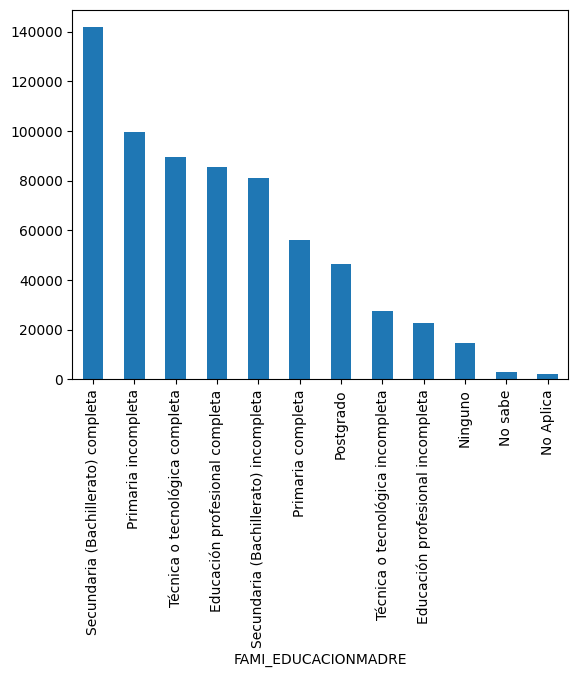
z.FAMI_EDUCACIONMADRE.value_counts().plot(kind='bar')
<Axes: xlabel='FAMI_EDUCACIONMADRE'>
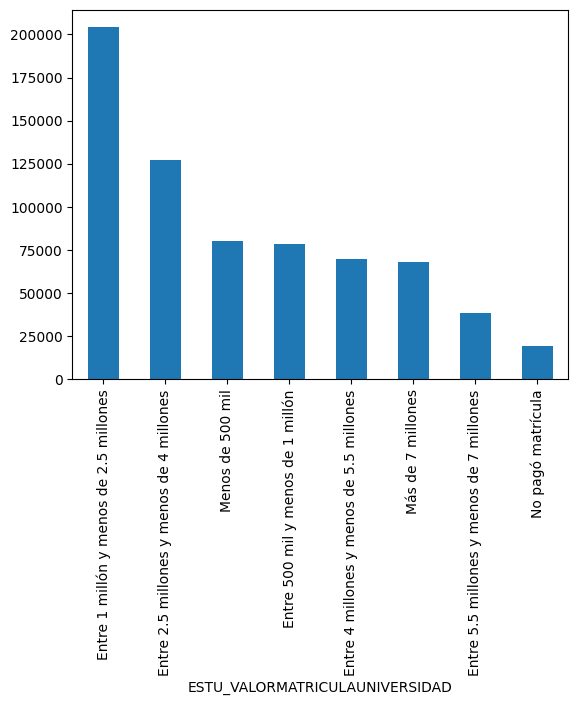
z.ESTU_VALORMATRICULAUNIVERSIDAD.value_counts().plot(kind='bar')
<Axes: xlabel='ESTU_VALORMATRICULAUNIVERSIDAD'>
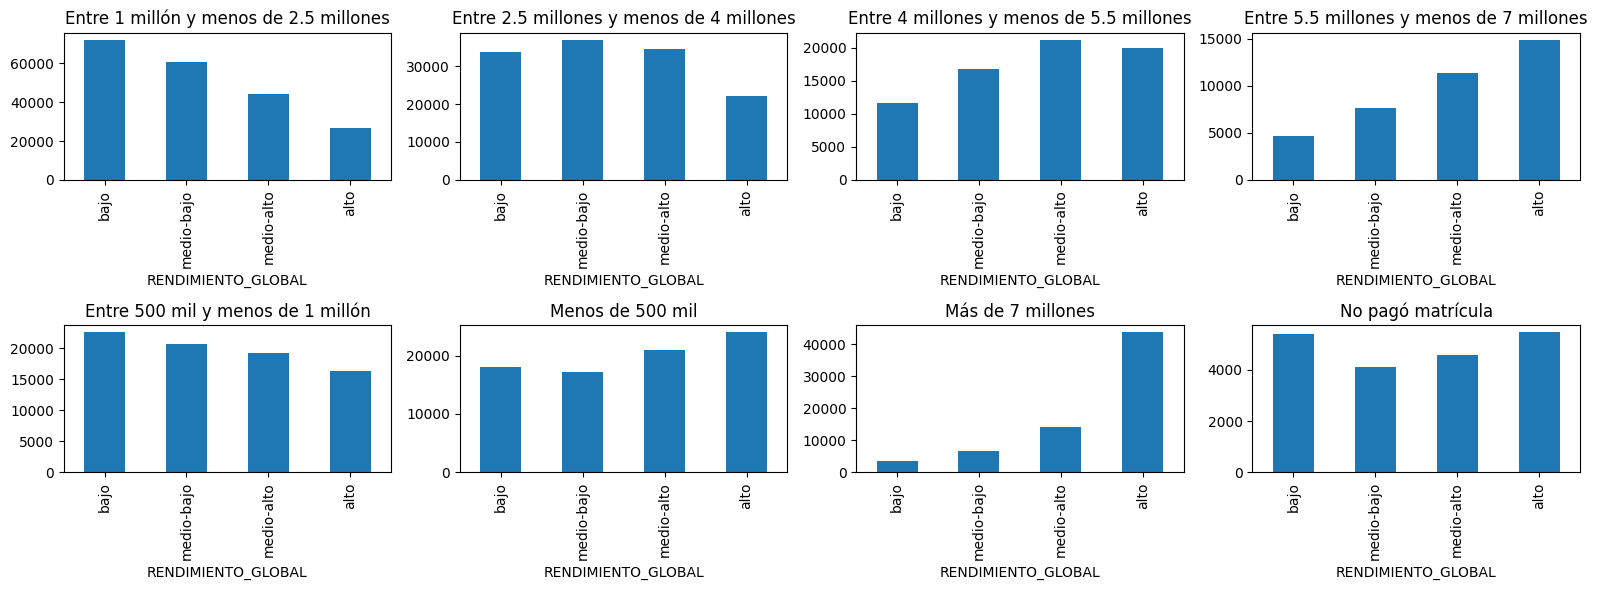
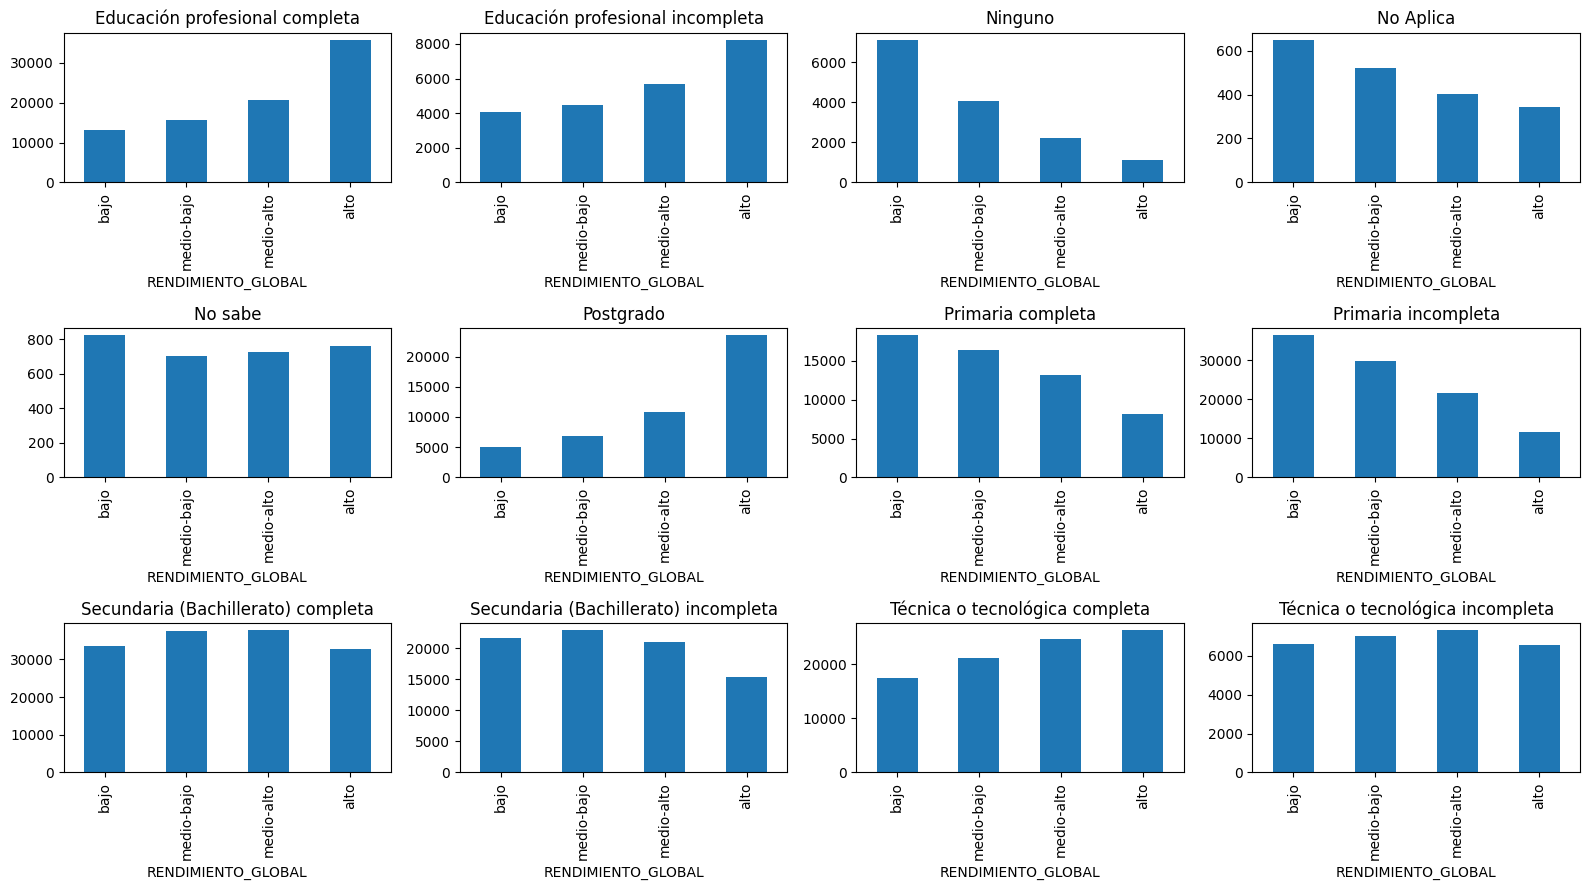
Inspect visually if these two columns have distinctive behaviour with respect to what we want to predict#
from rlxutils import subplots
import matplotlib.pyplot as plt

c = sorted(z.ESTU_VALORMATRICULAUNIVERSIDAD.value_counts().index)
for ax,ci in subplots(c, n_cols=4, usizex=4):
    zc = z[z.ESTU_VALORMATRICULAUNIVERSIDAD==ci]
    zc.RENDIMIENTO_GLOBAL.value_counts()[['bajo', 'medio-bajo', 'medio-alto', 'alto']].plot(kind='bar')
    plt.title(ci)
c = sorted(z.FAMI_EDUCACIONMADRE.value_counts().index)
for ax,ci in subplots(c, n_cols=4, usizex=4):
    zc = z[z.FAMI_EDUCACIONMADRE==ci]
    zc.RENDIMIENTO_GLOBAL.value_counts()[['bajo', 'medio-bajo', 'medio-alto', 'alto']].plot(kind='bar')
    plt.title(ci)
Basic cleanup#
considering that we have in total 692K data items, we have realatively few missing values on each column
sum(z.FAMI_EDUCACIONMADRE.isna()), sum(z.ESTU_VALORMATRICULAUNIVERSIDAD.isna())
(23664, 6287)
we will substitute nan values with a preset symbol to mark them
z.FAMI_EDUCACIONMADRE.values[z.FAMI_EDUCACIONMADRE.isna()] = 'no info'
z.ESTU_VALORMATRICULAUNIVERSIDAD.values[z.ESTU_VALORMATRICULAUNIVERSIDAD.isna()] = 'no info'
sum(z.FAMI_EDUCACIONMADRE.isna()), sum(z.ESTU_VALORMATRICULAUNIVERSIDAD.isna())
(0, 0)
Cleaning ESTU_VALORMATRICULAUNIVERSIDAD#
we convert ESTU_VALORMATRICULAUNIVERSIDAD to a continuous value since the ordering makes sense and we would like models to have a chance to capture it.
observe we assign no info to -1, which is somewhat artificial in this case
cmap = {'Entre 1 millón y menos de 2.5 millones': 1.75,
 'Entre 2.5 millones y menos de 4 millones': 3.25,
 'Menos de 500 mil': .250,
 'Entre 500 mil y menos de 1 millón': .75,
 'Entre 4 millones y menos de 5.5 millones': 4.75,
 'Más de 7 millones': 7.75,
 'Entre 5.5 millones y menos de 7 millones': 6.25,
 'No pagó matrícula': 0,
 'no info': -1}

z.ESTU_VALORMATRICULAUNIVERSIDAD = np.r_[[cmap[i] for i in z.ESTU_VALORMATRICULAUNIVERSIDAD]]
z.ESTU_VALORMATRICULAUNIVERSIDAD.value_counts()
| count | |
|---|---|
| ESTU_VALORMATRICULAUNIVERSIDAD | |
| 1.75 | 204048 |
| 3.25 | 127430 |
| 0.25 | 80263 |
| 0.75 | 78704 |
| 4.75 | 69736 |
| 7.75 | 68014 |
| 6.25 | 38490 |
| 0.00 | 19528 |
| -1.00 | 6287 |
Cleaning FAMI_EDUCACIONMADRE#
observe that for FAMI_EDUCACIONMADRE there could be many choices on how to deal with missing data
leave it as it is
unite
no info,No sabe,No Aplicainto a single symboletc.
since there are not so many No sabe, No aplica probably they wont have much effect on the final result so we will unite them into a single value so that there are not so many columns in the one hot encoding
z = z.copy()
z.FAMI_EDUCACIONMADRE = ['no info' if i in ['No sabe', 'No Aplica'] else i for i in z.FAMI_EDUCACIONMADRE.values]
z.FAMI_EDUCACIONMADRE.value_counts()
| count | |
|---|---|
| FAMI_EDUCACIONMADRE | |
| Secundaria (Bachillerato) completa | 141744 |
| Primaria incompleta | 99420 |
| Técnica o tecnológica completa | 89542 |
| Educación profesional completa | 85326 |
| Secundaria (Bachillerato) incompleta | 81012 |
| Primaria completa | 56125 |
| Postgrado | 46246 |
| no info | 28599 |
| Técnica o tecnológica incompleta | 27533 |
| Educación profesional incompleta | 22470 |
| Ninguno | 14483 |
first we create the onehot mapping
x = z.FAMI_EDUCACIONMADRE.values
FAMI_EDUCACIONMADRE_vals = sorted(np.unique(x))
FAMI_EDUCACIONMADRE_onehot_vals = {val: np.eye(len(FAMI_EDUCACIONMADRE_vals))[i] for i,val in enumerate(FAMI_EDUCACIONMADRE_vals)}
FAMI_EDUCACIONMADRE_onehot_vals
{'Educación profesional completa': array([1., 0., 0., 0., 0., 0., 0., 0., 0., 0., 0.]),
 'Educación profesional incompleta': array([0., 1., 0., 0., 0., 0., 0., 0., 0., 0., 0.]),
 'Ninguno': array([0., 0., 1., 0., 0., 0., 0., 0., 0., 0., 0.]),
 'Postgrado': array([0., 0., 0., 1., 0., 0., 0., 0., 0., 0., 0.]),
 'Primaria completa': array([0., 0., 0., 0., 1., 0., 0., 0., 0., 0., 0.]),
 'Primaria incompleta': array([0., 0., 0., 0., 0., 1., 0., 0., 0., 0., 0.]),
 'Secundaria (Bachillerato) completa': array([0., 0., 0., 0., 0., 0., 1., 0., 0., 0., 0.]),
 'Secundaria (Bachillerato) incompleta': array([0., 0., 0., 0., 0., 0., 0., 1., 0., 0., 0.]),
 'Técnica o tecnológica completa': array([0., 0., 0., 0., 0., 0., 0., 0., 1., 0., 0.]),
 'Técnica o tecnológica incompleta': array([0., 0., 0., 0., 0., 0., 0., 0., 0., 1., 0.]),
 'no info': array([0., 0., 0., 0., 0., 0., 0., 0., 0., 0., 1.])}
FAMI_EDUCACIONMADRE_onehot_enc = np.r_[[FAMI_EDUCACIONMADRE_onehot_vals[i] for i in z.FAMI_EDUCACIONMADRE]]
FAMI_EDUCACIONMADRE_onehot_enc
array([[0., 0., 0., ..., 0., 0., 0.],
       [0., 0., 0., ..., 0., 1., 0.],
       [0., 0., 0., ..., 0., 0., 0.],
       ...,
       [0., 0., 0., ..., 0., 0., 0.],
       [0., 0., 0., ..., 0., 0., 0.],
       [0., 0., 0., ..., 1., 0., 0.]])
FAMI_EDUCACIONMADRE_df = pd.DataFrame(FAMI_EDUCACIONMADRE_onehot_enc, columns=[f"FAMI_EDUCACIONMADRE__{v}" for v in FAMI_EDUCACIONMADRE_onehot_vals])
FAMI_EDUCACIONMADRE_df
| FAMI_EDUCACIONMADRE__Educación profesional completa | FAMI_EDUCACIONMADRE__Educación profesional incompleta | FAMI_EDUCACIONMADRE__Ninguno | FAMI_EDUCACIONMADRE__Postgrado | FAMI_EDUCACIONMADRE__Primaria completa | FAMI_EDUCACIONMADRE__Primaria incompleta | FAMI_EDUCACIONMADRE__Secundaria (Bachillerato) completa | FAMI_EDUCACIONMADRE__Secundaria (Bachillerato) incompleta | FAMI_EDUCACIONMADRE__Técnica o tecnológica completa | FAMI_EDUCACIONMADRE__Técnica o tecnológica incompleta | FAMI_EDUCACIONMADRE__no info | |
|---|---|---|---|---|---|---|---|---|---|---|---|
| 0 | 0.0 | 0.0 | 0.0 | 1.0 | 0.0 | 0.0 | 0.0 | 0.0 | 0.0 | 0.0 | 0.0 |
| 1 | 0.0 | 0.0 | 0.0 | 0.0 | 0.0 | 0.0 | 0.0 | 0.0 | 0.0 | 1.0 | 0.0 |
| 2 | 0.0 | 0.0 | 0.0 | 0.0 | 0.0 | 0.0 | 1.0 | 0.0 | 0.0 | 0.0 | 0.0 |
| 3 | 0.0 | 0.0 | 0.0 | 0.0 | 0.0 | 0.0 | 1.0 | 0.0 | 0.0 | 0.0 | 0.0 |
| 4 | 0.0 | 0.0 | 0.0 | 0.0 | 1.0 | 0.0 | 0.0 | 0.0 | 0.0 | 0.0 | 0.0 |
| ... | ... | ... | ... | ... | ... | ... | ... | ... | ... | ... | ... |
| 692495 | 0.0 | 0.0 | 0.0 | 0.0 | 0.0 | 0.0 | 0.0 | 1.0 | 0.0 | 0.0 | 0.0 |
| 692496 | 0.0 | 0.0 | 0.0 | 0.0 | 0.0 | 0.0 | 0.0 | 1.0 | 0.0 | 0.0 | 0.0 |
| 692497 | 0.0 | 0.0 | 0.0 | 0.0 | 0.0 | 0.0 | 0.0 | 1.0 | 0.0 | 0.0 | 0.0 |
| 692498 | 0.0 | 0.0 | 0.0 | 0.0 | 1.0 | 0.0 | 0.0 | 0.0 | 0.0 | 0.0 | 0.0 |
| 692499 | 0.0 | 0.0 | 0.0 | 0.0 | 0.0 | 0.0 | 0.0 | 0.0 | 1.0 | 0.0 | 0.0 |
692500 rows × 11 columns
and we assemble everything into a single dataframe, removing the original FAMI_EDUCACIONMADRE column.
we now have 13 columns … why?
z = pd.concat([FAMI_EDUCACIONMADRE_df, z], axis=1).drop('FAMI_EDUCACIONMADRE', axis=1)
z.shape
(692500, 13)
z.head()
| FAMI_EDUCACIONMADRE__Educación profesional completa | FAMI_EDUCACIONMADRE__Educación profesional incompleta | FAMI_EDUCACIONMADRE__Ninguno | FAMI_EDUCACIONMADRE__Postgrado | FAMI_EDUCACIONMADRE__Primaria completa | FAMI_EDUCACIONMADRE__Primaria incompleta | FAMI_EDUCACIONMADRE__Secundaria (Bachillerato) completa | FAMI_EDUCACIONMADRE__Secundaria (Bachillerato) incompleta | FAMI_EDUCACIONMADRE__Técnica o tecnológica completa | FAMI_EDUCACIONMADRE__Técnica o tecnológica incompleta | FAMI_EDUCACIONMADRE__no info | ESTU_VALORMATRICULAUNIVERSIDAD | RENDIMIENTO_GLOBAL | |
|---|---|---|---|---|---|---|---|---|---|---|---|---|---|
| 0 | 0.0 | 0.0 | 0.0 | 1.0 | 0.0 | 0.0 | 0.0 | 0.0 | 0.0 | 0.0 | 0.0 | 6.25 | medio-alto |
| 1 | 0.0 | 0.0 | 0.0 | 0.0 | 0.0 | 0.0 | 0.0 | 0.0 | 0.0 | 1.0 | 0.0 | 3.25 | bajo |
| 2 | 0.0 | 0.0 | 0.0 | 0.0 | 0.0 | 0.0 | 1.0 | 0.0 | 0.0 | 0.0 | 0.0 | 3.25 | bajo |
| 3 | 0.0 | 0.0 | 0.0 | 0.0 | 0.0 | 0.0 | 1.0 | 0.0 | 0.0 | 0.0 | 0.0 | 4.75 | alto |
| 4 | 0.0 | 0.0 | 0.0 | 0.0 | 1.0 | 0.0 | 0.0 | 0.0 | 0.0 | 0.0 | 0.0 | 3.25 | medio-bajo |
convert target (prediction) column into discrete values#
now everything in our dataset is numeric!!!
y_col = 'RENDIMIENTO_GLOBAL'

rmap = {'alto': 3, 'bajo':0, 'medio-bajo':1, 'medio-alto':2}
z[y_col] = [rmap[i] for i in z[y_col]]
z.head()
| FAMI_EDUCACIONMADRE__Educación profesional completa | FAMI_EDUCACIONMADRE__Educación profesional incompleta | FAMI_EDUCACIONMADRE__Ninguno | FAMI_EDUCACIONMADRE__Postgrado | FAMI_EDUCACIONMADRE__Primaria completa | FAMI_EDUCACIONMADRE__Primaria incompleta | FAMI_EDUCACIONMADRE__Secundaria (Bachillerato) completa | FAMI_EDUCACIONMADRE__Secundaria (Bachillerato) incompleta | FAMI_EDUCACIONMADRE__Técnica o tecnológica completa | FAMI_EDUCACIONMADRE__Técnica o tecnológica incompleta | FAMI_EDUCACIONMADRE__no info | ESTU_VALORMATRICULAUNIVERSIDAD | RENDIMIENTO_GLOBAL | |
|---|---|---|---|---|---|---|---|---|---|---|---|---|---|
| 0 | 0.0 | 0.0 | 0.0 | 1.0 | 0.0 | 0.0 | 0.0 | 0.0 | 0.0 | 0.0 | 0.0 | 6.25 | 2 |
| 1 | 0.0 | 0.0 | 0.0 | 0.0 | 0.0 | 0.0 | 0.0 | 0.0 | 0.0 | 1.0 | 0.0 | 3.25 | 0 |
| 2 | 0.0 | 0.0 | 0.0 | 0.0 | 0.0 | 0.0 | 1.0 | 0.0 | 0.0 | 0.0 | 0.0 | 3.25 | 0 |
| 3 | 0.0 | 0.0 | 0.0 | 0.0 | 0.0 | 0.0 | 1.0 | 0.0 | 0.0 | 0.0 | 0.0 | 4.75 | 3 |
| 4 | 0.0 | 0.0 | 0.0 | 0.0 | 1.0 | 0.0 | 0.0 | 0.0 | 0.0 | 0.0 | 0.0 | 3.25 | 1 |
build X and y for training a model#
observe we sort columns to make sure we always get the same ordering
z = z[sorted(z.columns)]

X = z[[c for c in z.columns if c!=y_col]].values
y = z[y_col].values
X.shape, y.shape
((692500, 12), (692500,))
split into train and test#
from sklearn.model_selection import train_test_split
Xtr, Xts, ytr, yts = train_test_split(X,y, train_size=0.8)
Xtr.shape, Xts.shape, ytr.shape, yts.shape
((554000, 12), (138500, 12), (554000,), (138500,))
Make a linear model for classification#
train model
from sklearn.linear_model import LogisticRegression

lr = LogisticRegression()
lr.fit(Xtr, ytr)
/usr/local/lib/python3.10/dist-packages/sklearn/linear_model/_logistic.py:460: ConvergenceWarning: lbfgs failed to converge (status=1):
STOP: TOTAL NO. of ITERATIONS REACHED LIMIT.

Increase the number of iterations (max_iter) or scale the data as shown in:
    https://scikit-learn.org/stable/modules/preprocessing.html
Please also refer to the documentation for alternative solver options:
    https://scikit-learn.org/stable/modules/linear_model.html#logistic-regression
  n_iter_i = _check_optimize_result(
LogisticRegression()In a Jupyter environment, please rerun this cell to show the HTML representation or trust the notebook.
On GitHub, the HTML representation is unable to render, please try loading this page with nbviewer.org.
LogisticRegression()
get predictions
preds_tr = lr.predict(Xtr)
preds_ts = lr.predict(Xts)
print (preds_tr[:10])
print (preds_ts[:10])
[3 0 0 0 2 0 0 1 3 3]
[3 1 1 3 3 3 2 3 3 3]
get accuracy and confusion matrices
np.mean(preds_tr==ytr), np.mean(preds_ts==yts)
(0.3474223826714801, 0.3464909747292419)
from sklearn.metrics import confusion_matrix
cm_tr = confusion_matrix(ytr, preds_tr)
cm_ts = confusion_matrix(yts, preds_ts)

# normalize by class
cm_tr = cm_tr / cm_tr.sum(axis=1).reshape(-1,1)
cm_ts = cm_ts / cm_ts.sum(axis=1).reshape(-1,1)
observe how each row in the confusion matrix adds up to 1. What does this mean?
import seaborn as sns
for ax,i in subplots(2, usizex=4):
  if i==0: sns.heatmap(cm_tr, annot=True); plt.title("confusion matrix train")
  if i==1: sns.heatmap(cm_ts, annot=True); plt.title("confusion matrix test")
  plt.ylabel("true")
  plt.xlabel("predicted")
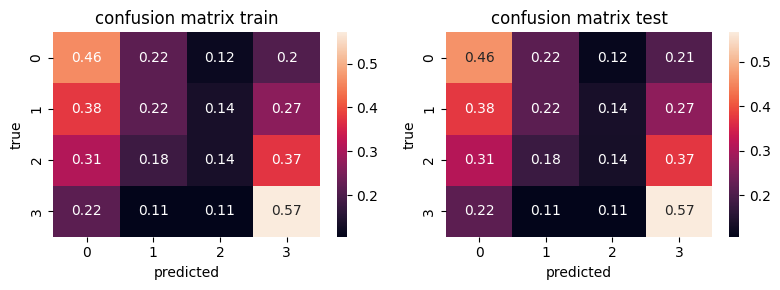
is the column FAMI_EDUCACIONMADRE really contributing?#
remove it and compare scores
zh = z[['ESTU_VALORMATRICULAUNIVERSIDAD', y_col]]

X = zh[[c for c in zh.columns if c!=y_col]].values
y = zh[y_col].values
X.shape, y.shape
((692500, 1), (692500,))
Xtr, Xts, ytr, yts = train_test_split(X,y, train_size=0.8)
lr_small = LogisticRegression()
lr_small.fit(Xtr, ytr)
LogisticRegression()In a Jupyter environment, please rerun this cell to show the HTML representation or trust the notebook.
On GitHub, the HTML representation is unable to render, please try loading this page with nbviewer.org.
LogisticRegression()
preds_tr = lr_small.predict(Xtr)
preds_ts = lr_small.predict(Xts)
np.mean(preds_tr==ytr), np.mean(preds_ts==yts)
(0.3179657039711191, 0.3163176895306859)
where is it helping?
cm_tr = confusion_matrix(ytr, preds_tr)
cm_ts = confusion_matrix(yts, preds_ts)

# normalize by class
cm_tr = cm_tr / cm_tr.sum(axis=1).reshape(-1,1)
cm_ts = cm_ts / cm_ts.sum(axis=1).reshape(-1,1)

import seaborn as sns
for ax,i in subplots(2, usizex=4):
  if i==0: sns.heatmap(cm_tr, annot=True); plt.title("confusion matrix train")
  if i==1: sns.heatmap(cm_ts, annot=True); plt.title("confusion matrix test")
  plt.ylabel("true")
  plt.xlabel("predicted")
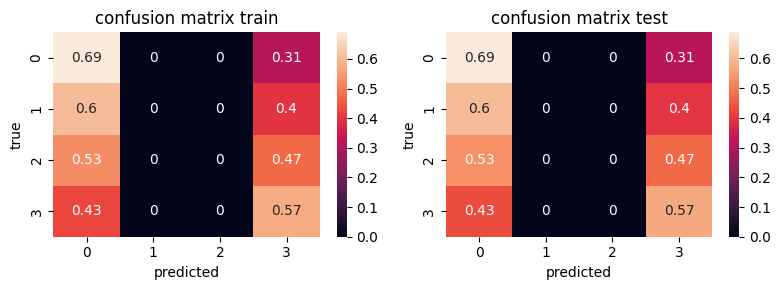
We keep the first model, now we apply the same procedure to test.csv#
observe:
there is no
RENDIMIENTO_GLOBALcolumnwe must keep the IDs so that we can create properly the submission file
zt = pd.read_csv("test.csv")
zt
| Unnamed: 0 | ID | PERIODO | ESTU_PRGM_ACADEMICO | ESTU_PRGM_DEPARTAMENTO | ESTU_VALORMATRICULAUNIVERSIDAD | ESTU_HORASSEMANATRABAJA | FAMI_ESTRATOVIVIENDA | FAMI_TIENEINTERNET | FAMI_EDUCACIONPADRE | FAMI_EDUCACIONMADRE | ESTU_PAGOMATRICULAPROPIO | |
|---|---|---|---|---|---|---|---|---|---|---|---|---|
| 0 | 0 | 550236 | 20183 | TRABAJO SOCIAL | BOLIVAR | Menos de 500 mil | Menos de 10 horas | Estrato 3 | Si | Técnica o tecnológica completa | Primaria completa | Si |
| 1 | 1 | 98545 | 20203 | ADMINISTRACION COMERCIAL Y DE MERCADEO | ANTIOQUIA | Entre 2.5 millones y menos de 4 millones | Entre 21 y 30 horas | Estrato 2 | Si | Secundaria (Bachillerato) completa | Técnica o tecnológica completa | No |
| 2 | 2 | 499179 | 20212 | INGENIERIA MECATRONICA | BOGOTÁ | Entre 1 millón y menos de 2.5 millones | 0 | Estrato 3 | Si | Secundaria (Bachillerato) incompleta | Secundaria (Bachillerato) completa | No |
| 3 | 3 | 782980 | 20195 | CONTADURIA PUBLICA | SUCRE | Entre 1 millón y menos de 2.5 millones | Entre 21 y 30 horas | Estrato 1 | No | Primaria incompleta | Primaria incompleta | No |
| 4 | 4 | 785185 | 20212 | ADMINISTRACION DE EMPRESAS | ATLANTICO | Entre 2.5 millones y menos de 4 millones | Entre 11 y 20 horas | Estrato 2 | Si | Secundaria (Bachillerato) completa | Secundaria (Bachillerato) completa | No |
| ... | ... | ... | ... | ... | ... | ... | ... | ... | ... | ... | ... | ... |
| 296781 | 296781 | 496981 | 20195 | ADMINISTRACION DE EMPRESAS | BOGOTÁ | Entre 2.5 millones y menos de 4 millones | Más de 30 horas | Estrato 1 | Si | Primaria incompleta | Primaria incompleta | Si |
| 296782 | 296782 | 209415 | 20183 | DERECHO | META | Entre 1 millón y menos de 2.5 millones | 0 | Estrato 4 | Si | Educación profesional completa | Educación profesional completa | No |
| 296783 | 296783 | 239074 | 20212 | DERECHO | BOGOTÁ | Entre 2.5 millones y menos de 4 millones | Más de 30 horas | Estrato 3 | Si | Secundaria (Bachillerato) completa | Educación profesional completa | No |
| 296784 | 296784 | 963852 | 20195 | INGENIERIA AERONAUTICA | ANTIOQUIA | Entre 5.5 millones y menos de 7 millones | Entre 11 y 20 horas | Estrato 3 | Si | Educación profesional completa | Educación profesional completa | No |
| 296785 | 296785 | 792650 | 20212 | INGENIERIA INDUSTRIAL | BOYACA | No pagó matrícula | 0 | Estrato 3 | Si | Secundaria (Bachillerato) completa | Secundaria (Bachillerato) completa | No |
296786 rows × 12 columns
zt_ids = zt['ID'].values
zt = zt[['FAMI_EDUCACIONMADRE', 'ESTU_VALORMATRICULAUNIVERSIDAD']]
print ("shape of loaded dataframe", zt.shape)
zt.head()
shape of loaded dataframe (296786, 2)
| FAMI_EDUCACIONMADRE | ESTU_VALORMATRICULAUNIVERSIDAD | |
|---|---|---|
| 0 | Primaria completa | Menos de 500 mil |
| 1 | Técnica o tecnológica completa | Entre 2.5 millones y menos de 4 millones |
| 2 | Secundaria (Bachillerato) completa | Entre 1 millón y menos de 2.5 millones |
| 3 | Primaria incompleta | Entre 1 millón y menos de 2.5 millones |
| 4 | Secundaria (Bachillerato) completa | Entre 2.5 millones y menos de 4 millones |
zt.FAMI_EDUCACIONMADRE.values[zt.FAMI_EDUCACIONMADRE.isna()] = 'no info'
zt.ESTU_VALORMATRICULAUNIVERSIDAD.values[zt.ESTU_VALORMATRICULAUNIVERSIDAD.isna()] = 'no info'
zt = zt.copy()
zt.ESTU_VALORMATRICULAUNIVERSIDAD = np.r_[[cmap[i] for i in zt.ESTU_VALORMATRICULAUNIVERSIDAD]]
zt.FAMI_EDUCACIONMADRE = ['no info' if i in ['No sabe', 'No Aplica'] else i for i in zt.FAMI_EDUCACIONMADRE.values]
FAMI_EDUCACIONMADRE_onehot_enc = np.r_[[FAMI_EDUCACIONMADRE_onehot_vals[i] for i in zt.FAMI_EDUCACIONMADRE]]
FAMI_EDUCACIONMADRE_df = pd.DataFrame(FAMI_EDUCACIONMADRE_onehot_enc, columns=[f"FAMI_EDUCACIONMADRE__{v}" for v in FAMI_EDUCACIONMADRE_onehot_vals])
zt = pd.concat([FAMI_EDUCACIONMADRE_df, zt], axis=1).drop('FAMI_EDUCACIONMADRE', axis=1)
zt.shape
(296786, 12)
zt
| FAMI_EDUCACIONMADRE__Educación profesional completa | FAMI_EDUCACIONMADRE__Educación profesional incompleta | FAMI_EDUCACIONMADRE__Ninguno | FAMI_EDUCACIONMADRE__Postgrado | FAMI_EDUCACIONMADRE__Primaria completa | FAMI_EDUCACIONMADRE__Primaria incompleta | FAMI_EDUCACIONMADRE__Secundaria (Bachillerato) completa | FAMI_EDUCACIONMADRE__Secundaria (Bachillerato) incompleta | FAMI_EDUCACIONMADRE__Técnica o tecnológica completa | FAMI_EDUCACIONMADRE__Técnica o tecnológica incompleta | FAMI_EDUCACIONMADRE__no info | ESTU_VALORMATRICULAUNIVERSIDAD | |
|---|---|---|---|---|---|---|---|---|---|---|---|---|
| 0 | 0.0 | 0.0 | 0.0 | 0.0 | 1.0 | 0.0 | 0.0 | 0.0 | 0.0 | 0.0 | 0.0 | 0.25 |
| 1 | 0.0 | 0.0 | 0.0 | 0.0 | 0.0 | 0.0 | 0.0 | 0.0 | 1.0 | 0.0 | 0.0 | 3.25 |
| 2 | 0.0 | 0.0 | 0.0 | 0.0 | 0.0 | 0.0 | 1.0 | 0.0 | 0.0 | 0.0 | 0.0 | 1.75 |
| 3 | 0.0 | 0.0 | 0.0 | 0.0 | 0.0 | 1.0 | 0.0 | 0.0 | 0.0 | 0.0 | 0.0 | 1.75 |
| 4 | 0.0 | 0.0 | 0.0 | 0.0 | 0.0 | 0.0 | 1.0 | 0.0 | 0.0 | 0.0 | 0.0 | 3.25 |
| ... | ... | ... | ... | ... | ... | ... | ... | ... | ... | ... | ... | ... |
| 296781 | 0.0 | 0.0 | 0.0 | 0.0 | 0.0 | 1.0 | 0.0 | 0.0 | 0.0 | 0.0 | 0.0 | 3.25 |
| 296782 | 1.0 | 0.0 | 0.0 | 0.0 | 0.0 | 0.0 | 0.0 | 0.0 | 0.0 | 0.0 | 0.0 | 1.75 |
| 296783 | 1.0 | 0.0 | 0.0 | 0.0 | 0.0 | 0.0 | 0.0 | 0.0 | 0.0 | 0.0 | 0.0 | 3.25 |
| 296784 | 1.0 | 0.0 | 0.0 | 0.0 | 0.0 | 0.0 | 0.0 | 0.0 | 0.0 | 0.0 | 0.0 | 6.25 |
| 296785 | 0.0 | 0.0 | 0.0 | 0.0 | 0.0 | 0.0 | 1.0 | 0.0 | 0.0 | 0.0 | 0.0 | 0.00 |
296786 rows × 12 columns
create X array and predict
X_test_data = zt[sorted(zt.columns)].values
X_test_data.shape
(296786, 12)
preds_test_data = lr.predict(X_test_data)
prepare submission#
first, map back the predictions to textual values
# inverse mapping
rmapi = {v:k for k,v in rmap.items()}
text_preds_test_data = [rmapi[i] for i in preds_test_data]
# create dataframe

submission = pd.DataFrame([zt_ids, text_preds_test_data], index=['ID', 'RENDIMIENTO_GLOBAL']).T
submission
| ID | RENDIMIENTO_GLOBAL | |
|---|---|---|
| 0 | 550236 | bajo |
| 1 | 98545 | alto |
| 2 | 499179 | medio-bajo |
| 3 | 782980 | bajo |
| 4 | 785185 | medio-alto |
| ... | ... | ... |
| 296781 | 496981 | bajo |
| 296782 | 209415 | alto |
| 296783 | 239074 | alto |
| 296784 | 963852 | alto |
| 296785 | 792650 | bajo |
296786 rows × 2 columns
# save to file ready to submit
submission.to_csv("my_submission.csv", index=False)
!head my_submission.csv
ID,RENDIMIENTO_GLOBAL
550236,bajo
98545,alto
499179,medio-bajo
782980,bajo
785185,medio-alto
58495,medio-bajo
705444,medio-alto
557548,alto
519909,medio-bajo
submission.shape
(296786, 2)
Send your submission to Kaggle#
You must join the competition first
!kaggle competitions submit -c udea-ai4eng-20242 -f my_submission.csv -m "raul ramos submission with linear model"
100% 3.88M/3.88M [00:00<00:00, 5.57MB/s]
Successfully submitted to UDEA/ai4eng 20242 - Pruebas Saber Pro Colombia
Things you can try#
other models (svm, random forest, gaussian, etc.)
different parameters in the models (like
gammafor svm, ormax_depthfor random forests). see the doc of each model insklearn.use different preprocessing and cleaning methods for different columns
create new columns manually, for instance,
group
ESTU_PRGM_ACADEMICOinto areas of knowlege (engineering, social sciences, etc.)do some operation between columns (multiply, concatenate, etc.)
integrate external data as new columns, for instance, economic data from each department in Colombia, for each different year, etc.

